

On Wednesday 21 August 2024, two PhD students from the group, MD Samiul Islam and Fei Yang, delivered an online guest lecture to a visiting group of students from THINK Global School (TGS). The session was arranged by Professor Irene Cheng, the group’s Scientific Director, who was travelling abroad at the time and invited two of her students to speak in her place. Both work on the group’s remote-sensing ground-deformation monitoring project and are experienced with machine learning.
TGS describes itself as the world’s first travelling high school. Its Changemaker curriculum takes teachers and students to several different countries each year. During their Vancouver module, the visiting students were exploring the driving question, “How can we improve earthquake preparedness in Vancouver through collaboration and AI innovation?” Their summative task asked them to design a proposal for an AI-driven early-warning system while weighing the ethical implications of applying AI in geology.
The lecture followed the four topics Professor Cheng had outlined, moving from how a radar satellite captures the ground, to what the resulting movement signals do and do not mean, to the machine learning that turns raw satellite data into answers.
1. Capturing the ground from orbit
Samiul opened with the general concept of satellite InSAR (Interferometric Synthetic Aperture Radar) data capture. A radar satellite passes over the same ground again and again, and the tiny differences in the returned radar signal between passes encode how far the surface moved in between. Combining two passes produces an interferogram; a stack of them, run through the group’s processing pipeline, becomes a map of ground motion and a movement history for every point.
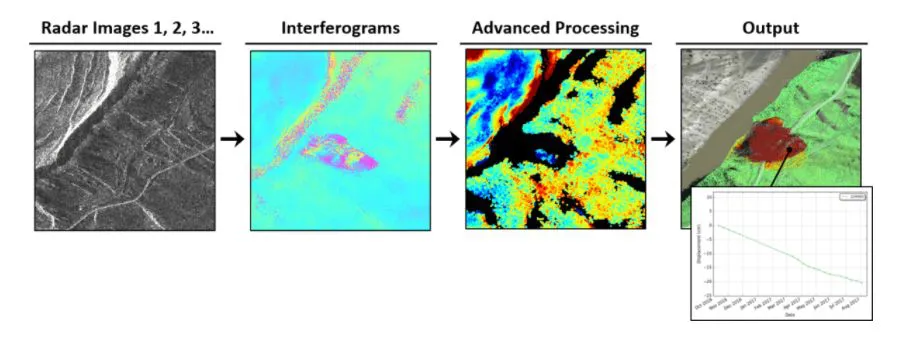 How InSAR works: repeat-pass satellite radar images are combined into interferograms and processed into millimetre-scale ground-motion maps and time series for individual points. InSAR imagery courtesy 3vGeomatics.
The catch, Samiul explained, is that the raw radar signal is measured as a wrapped phase that is noisy and, in some places, unreliable. Part of the science is knowing where to trust it: filtering cleans the phase, and a coherence map flags the areas where the signal is stable enough to believe.
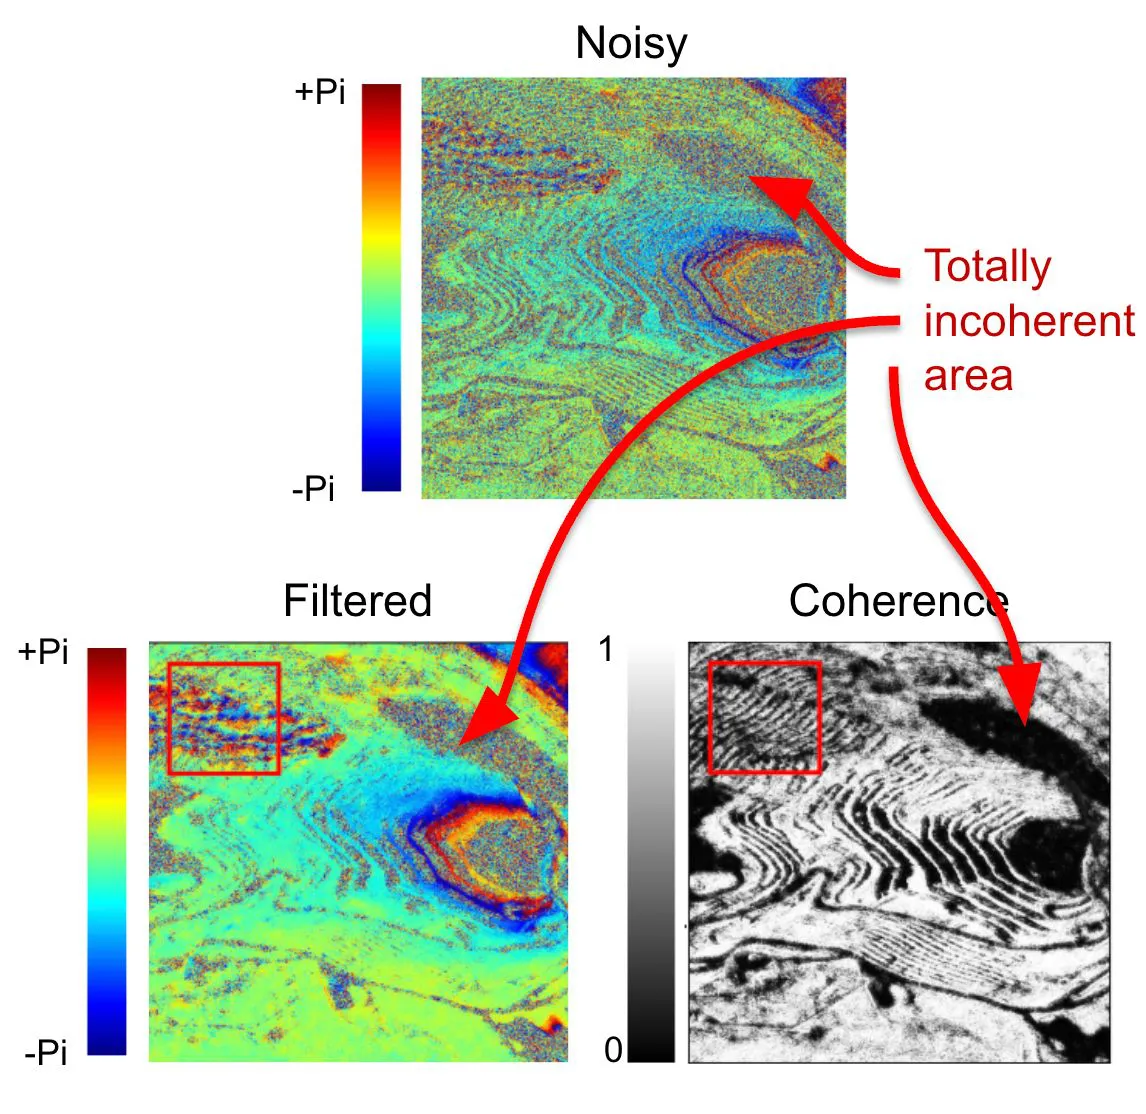 A raw interferogram is noisy (top); filtering cleans the phase (lower left); a coherence map (lower right) flags where the radar signal is reliable, and where it is not.
2. Reading movement, and what it cannot tell you
The second topic connected directly to the students’ project: how InSAR data is used to monitor ground deformation. Because InSAR resolves movement down to the millimetre across a whole city, it can reveal subsidence, uplift and strain building up over months and years. Vancouver sits in one of Canada’s most seismically active regions, so the same techniques that watch a runway or a bridge settle are relevant to understanding how the ground behaves under seismic stress.
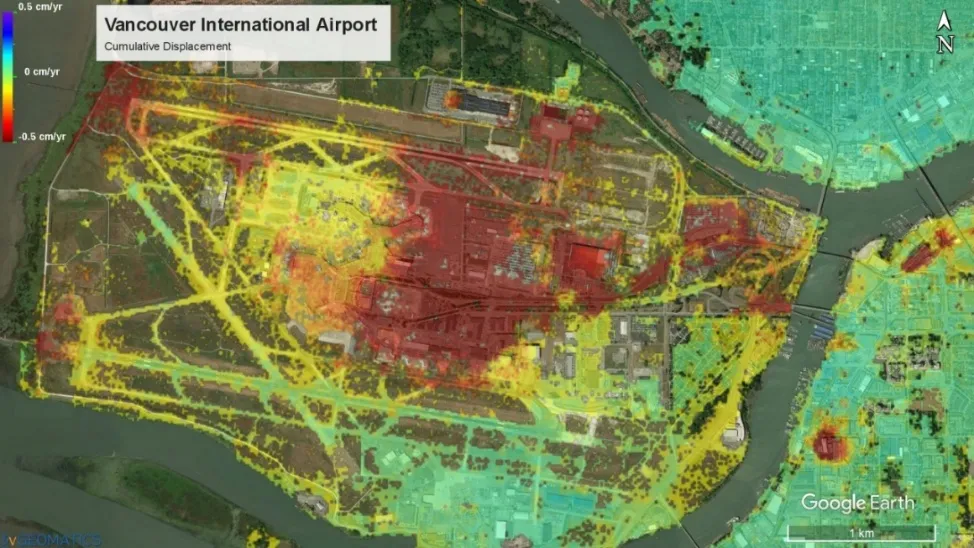 Cumulative ground displacement over Vancouver International Airport, resolved from satellite radar. The colours track how much each area has moved over time. InSAR imagery courtesy 3vGeomatics.
Samiul was careful about the limit, a point that fed straight into the students’ work on AI ethics. InSAR measures where and how fast the ground is moving; it does not predict when an earthquake will strike. It is a monitoring and preparedness tool, mapping strain and vulnerable infrastructure, not a crystal ball for the timing of future events. For students designing a responsible early-warning concept, the distinction between measuring deformation and forecasting an event was exactly the kind of nuance their task demanded.
3. Teaching machines to read satellites
Fei covered the third topic: the basic idea of using machine learning to explore satellite data. A single satellite scene can carry hundreds of millions of pixels and, in the hyperspectral case, hundreds of colour bands. Every surface, soil, water, a particular crop, reflects light in a characteristic pattern, and a model can be trained to read those patterns and turn raw imagery into labelled maps. Fei’s own research applies this to vegetation health, assessing pasture and crop condition from Sentinel-2 multispectral imagery.
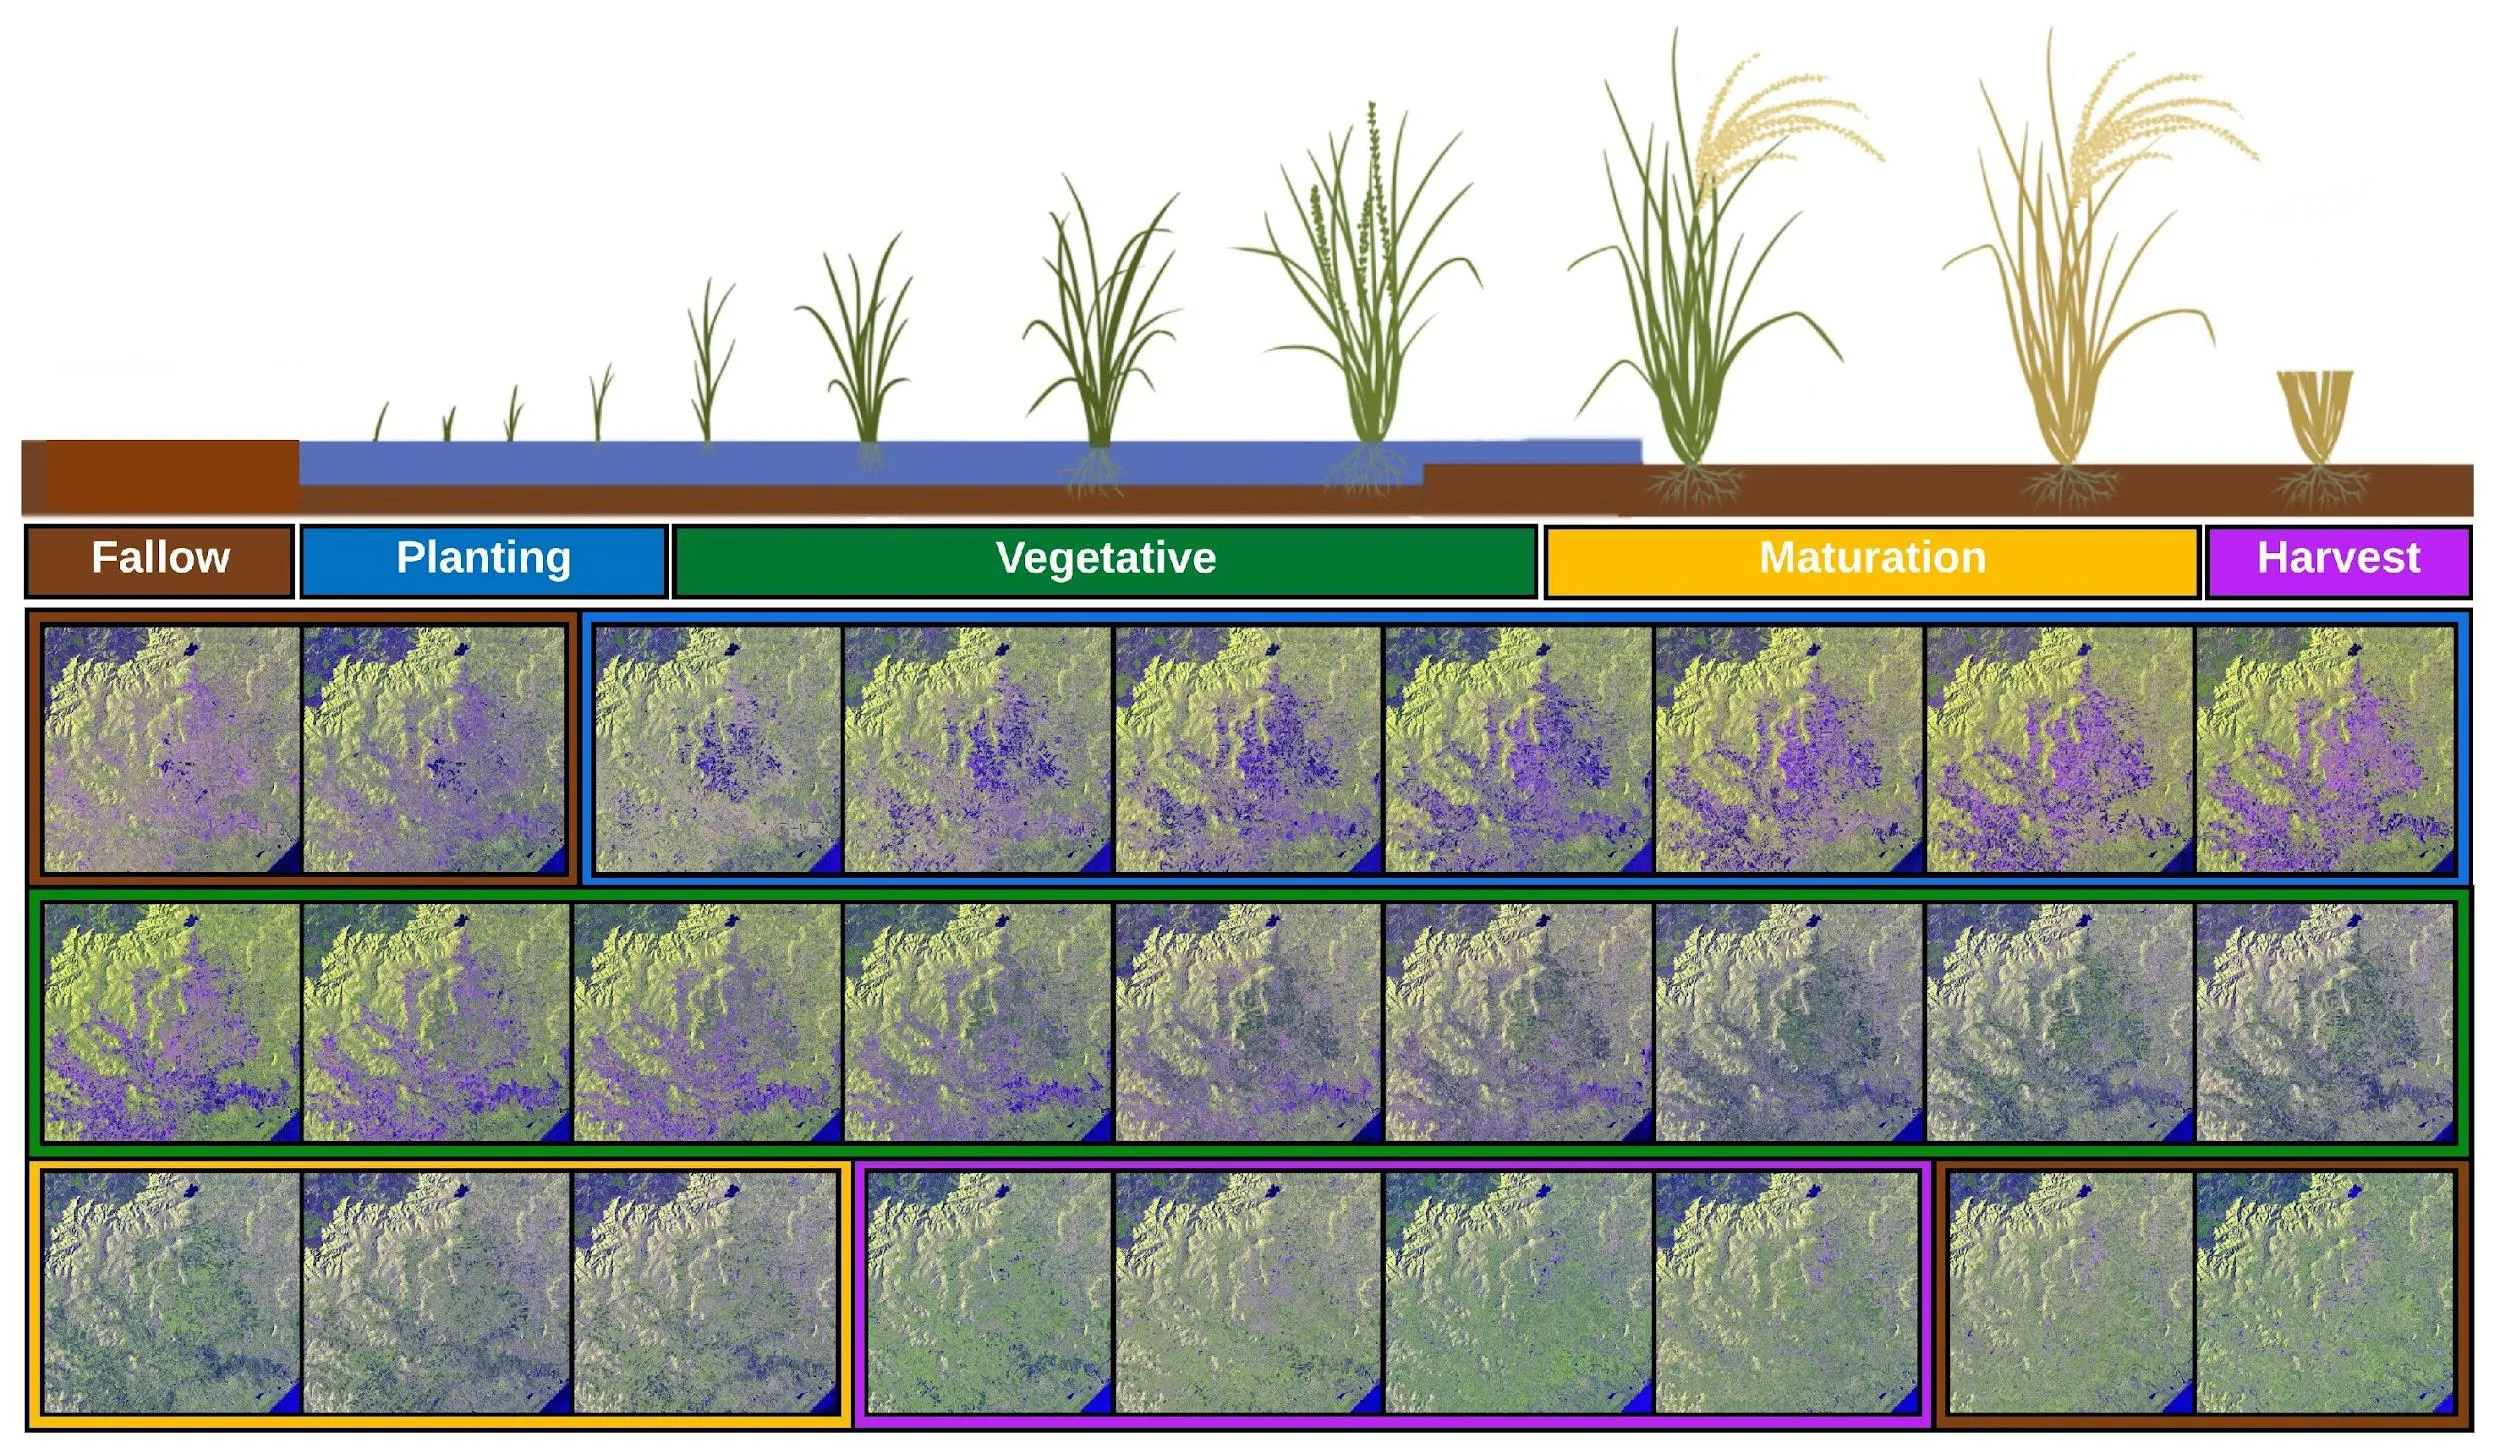 Machine learning reads a whole season: a crop’s growth stages leave a distinct signature across a time series of radar snapshots, which a model learns to recognise. Figure by the ROSS group.
4. Where else satellites help
Samiul closed with other applications of satellite data analysis. The clearest example is the group’s large-scale rice mapping: vision transformers applied to multi-temporal Sentinel-1 radar map rice fields across nine regions of southern and central Brazil, 42,481 km² in total, work carried out with Brazil’s National Institute for Space Research. The same recipe, learn a pattern from a season of satellite observations, then apply it at scale, supports food security, precision agriculture and environmental monitoring.
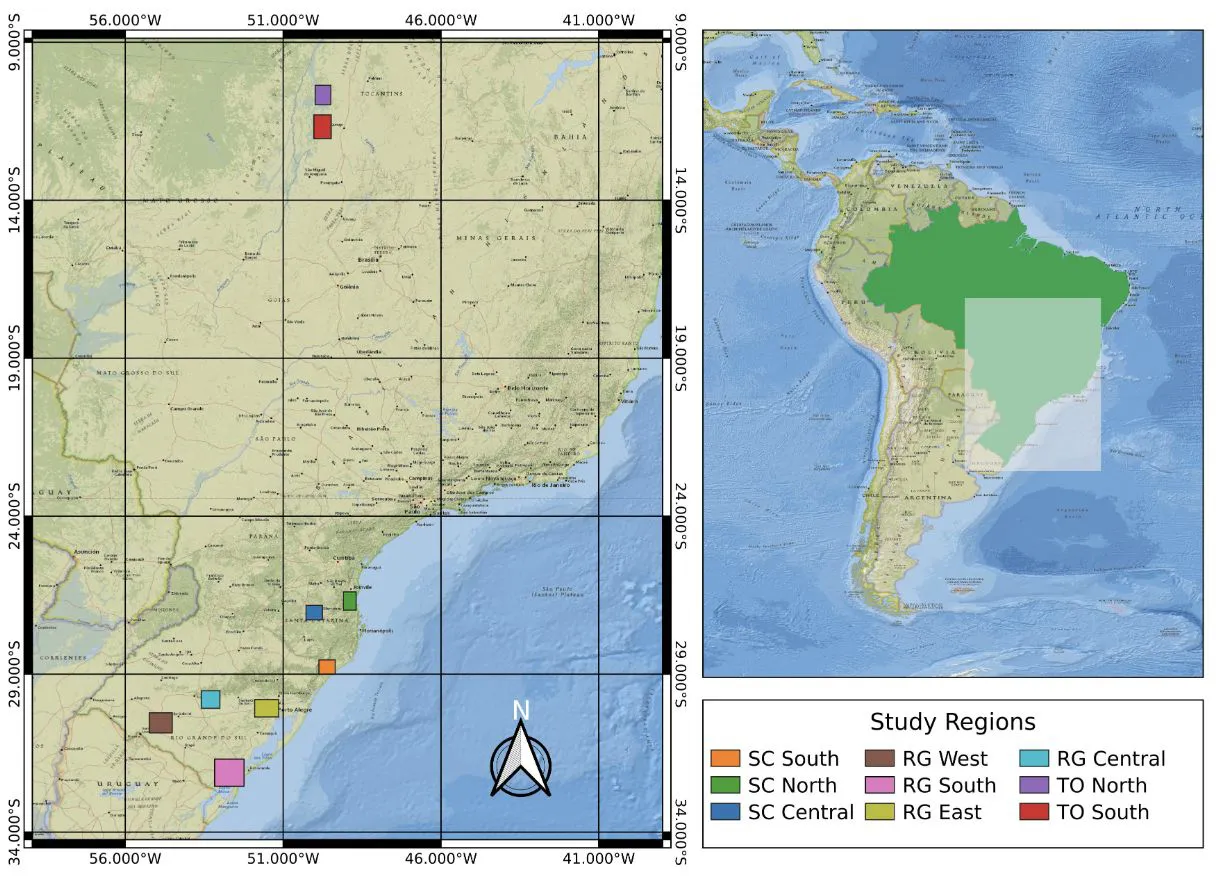 One application beyond deformation: mapping rice across nine regions of southern and central Brazil, 42,481 km² in total. Figure by the ROSS group.
The session connected the group’s founding Earth Observation theme to a high-school audience. Since 2017, ROSS has built industry-grade InSAR pipelines in collaboration with 3vGeomatics in Vancouver, tracking ground motion at city and region scale across roadways, railways, dams and mining. The cover image shows one such city-wide displacement map. For the visiting students, hearing directly from the researchers who build these pipelines turned an abstract classroom question about earthquake preparedness into a concrete look at the science, and the honest limits, behind real-world monitoring.
Further reading: THINK Global School